FVG Instantaneous Mitigation Signals [LuxAlgo]The FVG Instantaneous Mitigation Signals indicator detects and highlights "instantaneously" mitigated fair value gaps (FVG), that is FVGs that get mitigated one bar after their creation, returning signals upon mitigation.
Take profit/stop loss areas, as well as a trailing stop loss are also included to complement the signals.
🔶 USAGE
Instantaneous Fair Value Gap mitigation is a new concept introduced in this script and refers to the event of price mitigating a fair value gap one bar after its creation.
The resulting signal sentiment is opposite to the bias of the mitigated fair value gap. As such an instantaneously mitigated bearish FGV results in a bullish signal, while an instantaneously mitigated bullish FGV results in a bearish signal.
Fair value gap areas subject to instantaneous mitigation are highlighted alongside their average level, this level is extended until reached in a direction opposite to the FVG bias and can be used as a potential support/resistance level.
Users can filter out less volatile fair value gaps using the "FVG Width Filter" setting, with higher values highlighting more volatile fair value gaps subject to instantaneous mitigation.
🔹 TP/SL Areas
Users can enable take-profit/stop-loss areas. These are displayed upon a new signal formation, with an area starting from the mitigated FVG area average to this average plus/minus N ATRs, where N is determined by their respective multiplier settings.
Using a higher multiplier will return more distant areas from the price, requiring longer-term variations to be reached.
🔹 Trailing Stop Loss
A trailing-stop loss is included, increasing when the price makes a new higher high or lower low since the trailing has been set. Using a higher trailing stop multiplier will allow its initial position to be further away from the price, reducing its chances of being hit.
The trailing stop can be reset on "Every Signal", whether they are bullish or bearish, or only on an "Inverse Signal", which will reset the trailing when a signal of opposite bias is detected, this will preserve an existing trailing stop when a new signal of the same bias to the present one is detected.
🔶 DETAILS
Fair Value Gaps are ubiquitous to price action traders. These patterns arise when there exists a disparity between supply and demand. The action of price coming back and filling these imbalance areas is referred to as "mitigation" or "rebalancing".
"Instantaneous mitigation" refers to the event of price quickly mitigating a prior fair value gap, which in the case of this script is one bar after their creation. These events are indicative of a market more attentive to imbalances, and more willing to correct disparities in supply and demand.
If the market is particularly sensitive to imbalances correction then these can be excessively corrected, leading to further imbalances, highlighting a potential feedback process.
🔶 SETTINGS
FVG Width Filter: Filter out FVGs with thinner areas from returning a potential signal.
🔹 TP/SL
TP Area: Enable take-profit areas for new signals.
Multiplier: Control the distance from the take profit and the price, with higher values returning more distant TP's.
SL Area: Enable stop-loss areas for new signals.
Multiplier: Control the distance from the stop loss and the price, with higher values returning more distant SL's.
🔹 Trailing Stop
Reset Trailing Stop: Determines when the trailing stop is reset.
Multiplier: Controls the initial position of the trailing stop, with higher values returning more distant trailing stops.
스크립트에서 "Trailing stop"에 대해 찾기

Power Hour Money StrategyDescription of the Pine Script Code: "Power Hour Money Strategy"
This Pine Script strategy, "Power Hour Money Strategy," is designed to trade based on the alignment of multiple time frames (month, week, day, and hour). The strategy aims to enter long or short positions depending on whether all selected time frames are in sync (all green for long positions, all red for short positions). Additionally, the script includes configurations for trading during specific sessions and automatically closing positions at the end of the trading day.
Core Features:
1. Time Frame Sync Check:
- The strategy evaluates whether the current price is higher than the opening price for the month, week, day, and hour to determine if each time frame is "green" (bullish) or "red" (bearish).
2. Session Control:
- The user can select between different trading sessions:
- "NY Session 9:30-11:30"
- "Extended NY Session 8-4"
- "All Sessions"
- Trades are only executed if the current time falls within the selected session.
3. Trailing Stop Mechanism:
- The strategy includes an optional trailing stop mechanism for both long and short positions.
- The trailing stop is configured with a percentage loss from the current price to protect gains.
4. End-of-Day Position Management:
- An option is provided to automatically close all positions at the end of the trading day (5:45 PM Eastern Time).
Detailed Code Breakdown:
1. Input Settings:
- **Session Selection**: Allows the user to choose the trading session.
- **End-of-Day Close**: Option to automatically close positions at the end of the day.
- **Trailing Stop Loss**: Enables or disables the trailing stop loss feature and sets the percentage for long and short positions.
2. Time Frame Calculations:
- The script uses `request.security` to get the opening prices for higher time frames (monthly, weekly, daily, and hourly).
- It compares the current close price to these opening prices to determine if each time frame is green or red.
3. Session Time Definitions:
- Defines the start and end times for the NY session (9:30-11:30 AM) and the extended session (8:00 AM - 4:00 PM).
4. Trade Execution:
- The strategy checks if all selected time frames are in sync and if the current time falls within the trading session.
- If all conditions are met, it enters a long or short position.
5. Trailing Stop Loss Implementation:
- Adjusts the stop price based on the trailing percentage and the current position's size.
- Automatically exits positions if the trailing stop condition is met.
6. End-of-Day Close Implementation:
- Uses a timestamp to check if the current time is 5:45 PM Eastern Time.
- Closes all positions if the end-of-day condition is met.
7. Plotting and Logging:
- Plots indicators to visualize the green/red status of each time frame.
- Logs information about the status of each time frame for debugging and analysis.
Example Usage:
Entering a Long Position: If the month, week, day, and hour are all green and the current time is within the selected session, a long position is entered.
Entering a Short Position: If the month, week, day, and hour are all red and the current time is within the selected session, a short position is entered.
Trailing Stop: Protects gains by exiting the position if the price moves against the set trailing stop percentage.
End-of-Day Close: Automatically closes all open positions at 5:45 PM Eastern Time if enabled.
This strategy is particularly useful for traders who want to ensure that multiple time frames are in alignment before entering a trade and who wish to manage positions effectively throughout the trading day with specific session controls and trailing stops.

Volatility System by W. WilderVolatility System (Volatility Stops) Similarity
Most traders adjust their stops over time in the direction of the trend in order to lock in profits. Apart from moving averages, one of the most popular techniques is trailing stops using a multiple of Average True Range. There are several variations:
The original Volatility System(Volatility Stops), introduced by Welles Wilder in his 1978 book: New Concepts in Technical Trading Systems
Chandelier exits introduced by Alexander Elder in Come Into My Trading Room (2002) trail the stops from Highs or Lows rather than Closing Price
Average True Range Trailing Stops are similar to the above, but include a ratchet mechanism to prevent stops moving down during an up-trend or rising during a down-trend, as ATR increases
WillTrend intoduced by Larry Williams in 1988
Comparison of systems
All the systems under consideration have one common ingredient - ATR. ATR was developed by Welles Wilder and described in his book in 1978, also in this book the Volatility System was described, which in the future became known as Volatility Stops.
In fact, Wilder is the father of such systems due to the presence of ATR in the calculation of this type of indicator.
The main difference of Volatility System
Followers such as Larry Williams and Alexander Elder made minor changes to the value based on the ATR, mainly focusing on changing the base to which this value is added or subtracted.
Larry Williams uses the square root of 5 as a multiplier and calculates the ATR with a period of 66, and Alexander Elder uses a multiplier of 2.5-3.5 applying it to the ATR with a period of 22. Both authors changed the original value for ATR and multiplier calculations. Alexander Elder is closest to the original Welles Wilder calculation, which used a multiplier of 2.8.-3.1 applying it to an ATR with a period of 7.
As a reference, Elder took the Highest High(22) from which he subtracts ATR*Multiplier in an uptrend or the Lowest Low(22) to which he adds ATR*Multiplier to obtain the turning point (SAR).
Larry Williams uses the average price of extremes (Highest High(10) + Lowest Low(10)) / 2 as a reference base to which he adds or subtracts the ATR*Multilpyer values.
Both systems differ from the original, because Wilder used Significan Close(SIC) in his calculations. SIC is the maximum closing price during an uptrend and the minimum closing price during a downtrend, which
does not go beyond the current trade, as in other systems. To calculate the base when a trend changes, bars that are outside the current trend will be used when calculating WillTrend and Chandelier Exit, in contrast to the Volatility System, which takes SIC values only within the current trade. This is the main difference from subsequent developments of similar systems.
Improvements made
The original Volatility System is present as an indicator on TradingView, but it is an improved version with the addition of a ratchet and works differently from the original Weilder system.
List of improvements:
Added the ability to remove the ratchet. You need to turn off the "Trail one way" checkbox in the setting menu. When this function is turned off, the system will operate in the author-inventor mode. On some instruments, the original system works much better than the improved ratchet system, which cannot be turned off.
Added the ability to use Highest High and Lowest Low as a base instead of the closing price.
Volatility Stops Formula Description
Welles Wilder's system uses Closing Price and incorporates a stop-and-reverse feature (as with his Parabolic SAR).
Determine the initial trend direction
Calculate the Significant Close ("SIC"): the highest close reached in an up-trend or the lowest close in a down-trend
Calculate Average True Range ("ATR") for the selected period (7 days in this example)
Multiply ATR by the Multiple (3.0 in this example, best values author describes as 2.8-3.1)
The first stop is calculated in day 7 and plotted for day 8
If an up-trend, the first stop is SIC - 3 * ATR, otherwise SIC + 3 * ATR for a down-trend
Repeat each day until price closes below the stop (or above in a down-trend)
Set SIC equal to the latest Close, reverse the trend and continue.
Chandelier Exit Description
Chandelier Exits subtract a multiple of Average True Range ("ATR") from the highest high for the selected period. Using the default settings as an example:
Highest High in last 22 days - 3 * ATR for 22 days
In a down-trend the formula is reversed:
Lowest Low in last 22 days + 3 * ATR for 22 days
The time period must be long enough to capture the highest point of the recent up-trend: too short and the stops move downward; too long and the high may be taken from a previous down-trend.
It is not essential to use the same period for up and down trends; down-trends are notoriously faster than up-trends and may benefit from a shorter time period.
The multiple of 3 may be varied, but most traders settle between 2.5 and 3.5.
WillTrend Description
Larry Williams is prefer to used the Square Root from 5 as a multiplayer for ATR. SQRT(5) = 2.236
WillTrend subtract a multiple of Average True Range ("ATR") from the Middle Price (Highest High for the selected period + Lowest Low for the selected period / 2).
(Highest High in last 10 days + Lowest Low in last 10 days) / 2 - 2.236 * ATR for 66 days
In a down-trend the formula is reversed:
(Highest High in last 10 days + Lowest Low in last 10 days) / 2 + 2.236 * ATR for 66 days

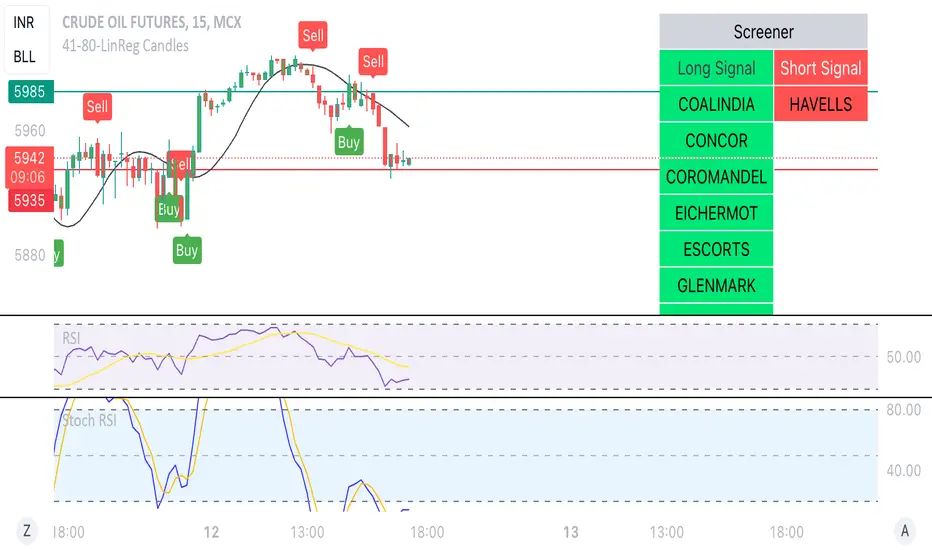
Linear Reg CandlesThe provided Pine Script is a TradingView script for creating a technical analysis indicator called "Humble LinReg Candles." This script includes features such as linear regression for open, high, low, and close prices, signal smoothing with simple or exponential moving averages, and a trailing stop based on Average True Range (ATR). Additionally, the script contains a screener section to display signals for a list of specified symbols.
Here is a breakdown of the script:
Indicator Settings:
It defines various input parameters such as signal smoothing length, linear regression settings, and options for using simple moving averages.
Linear regression is applied to open, high, low, and close prices based on user-defined settings.
ATR Trailing Stop:
It calculates the Average True Range (ATR) and uses it to determine a trailing stop for buy and sell signals.
Signals are generated based on whether the close price is above or below the ATR trailing stop.
Plotting:
The script plots the calculated signal on the chart using the plot function.
Buy and Sell Conditions:
Buy and sell conditions are defined based on the relationship between the close price and the ATR trailing stop.
Plot shapes and bar colors are used to visually represent buy and sell signals on the chart.
Alerts:
Alerts are triggered when buy or sell conditions are met.
Screener Section:
The script defines a screener section to display a watchlist of symbols with long and short signals.
The watchlist includes a set of predefined symbols with corresponding long and short signals.
Table Theme Settings:
The script allows customization of the table theme, including background color, frame color, and text color.
The size and location of the table on the chart can also be customized.
Screener Function:
A function getSignal is defined to determine long and short signals for each symbol in the watchlist.
The getSym function is used to extract the symbol name from the symbol string.
Dashboard Creation:
The script creates a table (dashboard) to display long and short signals for the symbols in the watchlist.
The table includes headers for "Long Signal" and "Short Signal" and lists the symbols with corresponding signals.
Overall, the script combines technical analysis indicators and a screener to help traders identify potential buy and sell signals for a set of specified symbols.
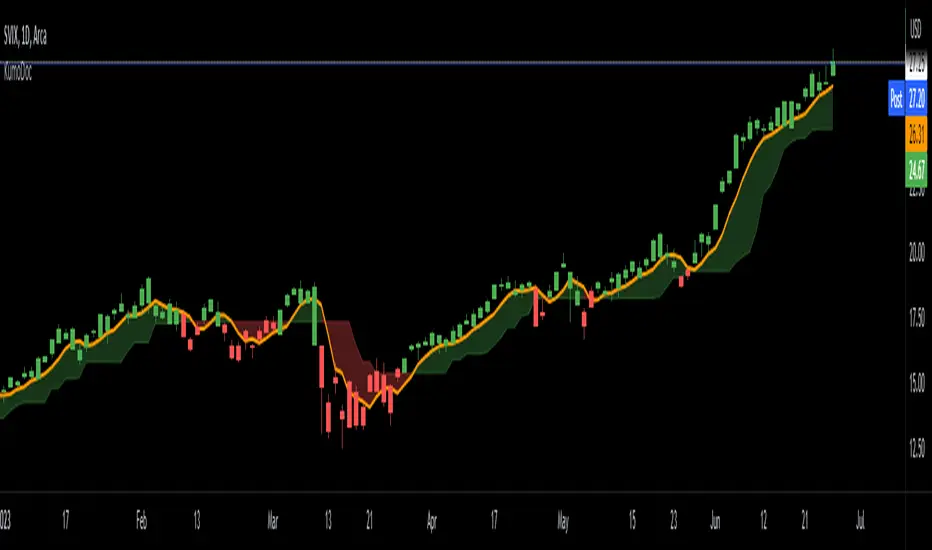
IKH Cloud V1.0 (nextSignals)The IKH Cloud V1.0 (nextSignals) is an Ichomoku-type indicator that can be used for various trading strategies. It's based on a ThinkScript study from @stephenharlinmd (aka nextSignals) that uses an instantaneous moving average as the base MA, and a custom trailing stop. Both of these components form the cloud.
Indicator Components and Calculation
The indicator comprises two key components:
Instantaneous Moving Average (IMA) : This is a type of moving average that places a greater weight on the most recent data points, and is based on Ehler's book "Rocket Science for Traders". This is slightly different from the Doc's original, but is very approximate.
Trailing Stop : This component helps determine the stop loss level that moves along with the price. The trailing stop is based on the highest high and the lowest low of the last 5 bars, as well as the simple moving averages of the low and high of the previous bar. The trailing stop is calculated separately for each condition: when the bar index is greater than 1 and when the previous 'a' variable is either 1 or 0.
These two components are used to create a filled area on the chart, also known as the 'cloud'. The color of the cloud and the candlesticks change based on the relative positions of the IMA and the trailing stop.
How to Use the Indicator
The following are just ideas on how to use this indicator, and is not financial advice in any form:
Trend Identification: When the IMA is above the trailing stop (cloud), it indicates an uptrend, and when it's below, it indicates a downtrend.
Entry/Exit Signals: Traders can consider going long when the candlesticks move above the cloud and short when they move below the cloud.
Stop Loss Level: The trailing stop line (the cloud's edge) can serve as a dynamic stop loss level.
Please don't use just this indicator on its own. Please use this in conjunction with other analysis tools, indicators, and systems you already have in place. Always consider the overall market context and use appropriate risk management strategies.
Bjorgum Double Tap█ OVERVIEW
Double Tap is a pattern recognition script aimed at detecting Double Tops and Double Bottoms. Double Tap can be applied to the broker emulator to observe historical results, run as a trading bot for live trade alerts in real time with entry signals, take profit, and stop orders, or to simply detect patterns.
█ CONCEPTS
How Is A Pattern Defined?
Doubles are technical formations that are both reversal patterns and breakout patterns. These formations typically have a distinctive “M” or a “W” shape with price action breaking beyond the neckline formed by the center of the pattern. They can be recognized when a pivot fails to break when tested for a second time and the retracement that follows breaks beyond the key level opposite. This can trap entrants that were playing in the direction of the prior trend. Entries are made on the breakout with a target projected beyond the neckline equal to the height of the pattern.
Pattern Recognition
Patterns are recognized through the use of zig-zag; a method of filtering price action by connecting swing highs and lows in an alternating fashion to establish trend, support and resistance, or derive shapes from price action. The script looks for the highest or lowest point in a given number of bars and updates a list with the values as they form. If the levels are exceeded, the values are updated. If the direction changes and a new significant point is made, a new point is added to the list and the process starts again. Meanwhile, we scan the list of values looking for the distinctive shape to form as previously described.
█ STRATEGY RESULTS
Back Testing
Historical back testing is the most common method to test a strategy due in part to the general ease of gathering quick results. The underlying theory is that any strategy that worked well in the past is likely to work well in the future, and conversely, any strategy that performed poorly in the past is likely to perform poorly in the future. It is easy to poke holes in this theory, however, as for one to accept it as gospel, one would have to assume that future results will match what has come to pass. The randomness of markets may see to it otherwise, so it is important to scrutinize results. Some commonly used methods are to compare to other markets or benchmarks, perform statistical analysis on the results over many iterations and on differing datasets, walk-forward testing, out-of-sample analysis, or a variety of other techniques. There are many ways to interpret the results, so it is important to do research and gain knowledge in the field prior to taking meaningful conclusions from them.
👉 In short, it would be naive to place trust in one good backtest and expect positive results to continue. For this reason, results have been omitted from this publication.
Repainting
Repainting is simply the difference in behaviour of a strategy in real time vs the results calculated on the historical dataset. The strategy, by default, will wait for confirmed signals and is thus designed to not repaint. Waiting for bar close for entires aligns results in the real time data feed to those calculated on historical bars, which contain far less data. By doing this we align the behaviour of the strategy on the 2 data types, which brings significance to the calculated results. To override this behaviour and introduce repainting one can select "Recalculate on every tick" from the properties tab. It is important to note that by doing this alerts may not align with results seen in the strategy tester when the chart is reloaded, and thus to do so is to forgo backtesting and restricts a strategy to forward testing only.
👉 It is possible to use this script as an indicator as opposed to a full strategy by disabling "Use Strategy" in the "Inputs" tab. Basic alerts for detection will be sent when patterns are detected as opposed to complex order syntax. For alerts mid-bar enable "Recalculate on every tick" , and for confirmed signals ensure it is disabled.
█ EXIT ORDERS
Limit and Stop Orders
By default, the strategy will place a stop loss at the invalidation point of the pattern. This point is beyond the pattern high in the case of Double Tops, or beneath the pattern low in the case of Double Bottoms. The target or take profit point is an equal-legs measurement, or 100% of the pattern height in the direction of the pattern bias. Both the stop and the limit level can be adjusted from the user menu as a percentage of the pattern height.
Trailing Stops
Optional from the menu is the implementation of an ATR based trailing stop. The trailing stop is designed to begin when the target projection is reached. From there, the script looks back a user-defined number of bars for the highest or lowest point +/- the ATR value. For tighter stops the user can look back a lesser number of bars, or decrease the ATR multiple. When using either Alertatron or Trading Connector, each change in the trail value will trigger an alert to update the stop order on the exchange to reflect the new trail price. This reduces latency and slippage that can occur when relying on alerts only as real exchange orders fill faster and remain in place in the event of a disruption in communication between your strategy and the exchange, which ensures a higher level of safety.
👉 It is important to note that in the case the trailing stop is enabled, limit orders are excluded from the exit criteria. Rather, the point in time that the limit value is exceeded is the point that the trail begins. As such, this method will exit by stop loss only.
█ ALERTS
Five Built-in 3rd Party Destinations
The following are five options for delivering alerts from Double Tap to live trade execution via third party API solutions or chat bots to share your trades on social media. These destinations can be selected from the input menu and alert syntax will automatically configure in alerts appropriately to manage trades.
Custom JSON
JSON, or JavaScript Object Notation, is a readable format for structuring data. It is used primarily to transmit data between a server and a web application. In regards to this script, this may be a custom intermediary web application designed to catch alerts and interface with an exchange API. The JSON message is a trade map for an application to read equipped with where its been, where its going, targets, stops, quantity; a full diagnostic of the current state and its previous state. A web application could be configured to follow the messages sent in this format and conduct trades in sync with alerts running on the TV server.
Below is an example of a rendered JSON alert:
{
"passphrase": "1234",
"time": "2022-05-01T17:50:05Z",
"ticker": "ETHUSDTPERP",
"plot": {
"stop_price": 2600.15,
"limit_price": 3100.45
},
"strategy": {
"position_size": 0.1,
"order_action": "buy",
"market_position": "long",
"market_position_size": 0,
"prev_market_position": "flat",
"prev_market_position_size": 0
}
}
Trading Connector
Trading Connector is a third party fully autonomous Chrome extension designed to catch alert webhooks from TradingView and interface with MT4/MT5 to execute live trades from your machine. Alerts to Trading Connector are simple; just select the destination from the input drop down menu, set your ticker in the "TC Ticker" box in the "Alert Strings" section and enter your URL in the alert window when configuring your alert.
Alertatron
Alertatron is an automated algo platform for cryptocurrency trading that is designed to automate your trading strategies. Although the platform is currently restricted to crypto, it offers a versatile interface with high flexibility syntax for complex market orders and conditions. To direct alerts to Alertatron, select the platform from the 3rd party drop down, configure your API key in the ”Alertatron Key” box and add your URL in the alert message box when making alerts.
3 Commas
3 Commas is an easy and quick to use click-and-go third party crypto API solution. Alerts are simple without overly complex syntax. Messages are simply pasted into alerts and executed as alerts are triggered. There are 4 boxes at the bottom of the "Inputs" tab where the appropriate messages to be placed. These messages can be copied from 3 Commas after the bots are set up and pasted directly into the settings menu. Remember to select 3 Commas as a destination from the third party drop down and place the appropriate URL in the alert message window.
Discord
Some may wish to share their trades with their friends in a Discord chat via webhook chat bot. Messages are configured to notify of the pattern type with targets and stop values. A bot can be configured through the integration menu in a Discord chat to which you have appropriate access. Select Discord from the 3rd party drop down menu and place your chat bot URL in the alert message window when configuring alerts.
👉 For further information regarding alert setup, refer to the platform specific instructions given by the chosen third party provider.
█ IMPORTANT NOTES
Setting Alerts
For alert messages to be properly delivered on order fills it is necessary to place the following placeholder in the alert message box when creating an alert.
{{strategy.order.alert_message}}
This placeholder will auto-populate the alert message with the appropriate syntax that is designated for the 3rd party selected in the user menu.
Order Sizing and Commissions
The values that are sent in alert messages are populated from live metrics calculated by the strategy. This means that the actual values in the "Properties" tab are used and must be set by the user. The initial capital, order size, commission, etc. are all used in the calculations, so it is important to set these prior to executing live trades. Be sure to set the commission to the values used by the exchange as well.
👉 It is important to understand that the calculations on the account size take place from the beginning of the price history of the strategy. This means that if historical results have inflated or depleted the account size from the beginning of trade history until now, the values sent in alerts will reflect the calculated size based on the inputs in the "Properties" tab. To start fresh, the user must set the date in the "Inputs" tab to the current date as to remove trades from the trade history. Failure to follow this instruction can result in an unexpected order size being sent in the alert.
█ FOR PINECODERS
• With the recent introduction of matrices in Pine, the script utilizes a matrix to track pivot points with the bars they occurred on, while tracking if that pivot has been traded against to prevent duplicate detections after a trade is exited.
• Alert messages are populated with placeholders ; capability that previously was only possible in alertcondition() , but has recently been extended to `strategy.*()` functions for use in the `alert_message` argument. This allows delivery of live trade values to populate in strategy alert messages.
• New arguments have been added to strategy.exit() , which allow differentiated messages to be sent based on whether the exit occurred at the stop or the limit. The new arguments used in this script are `alert_profit` and `alert_loss` to send messages to Discord

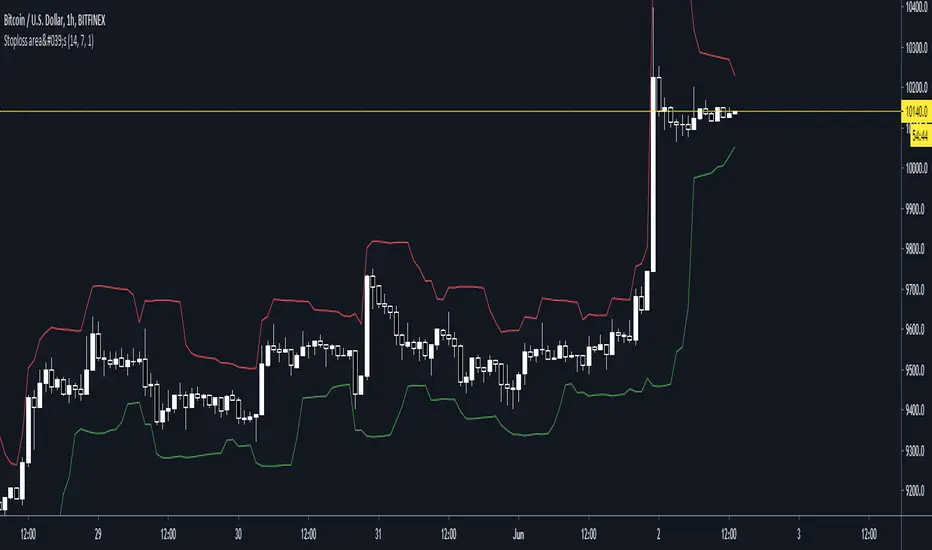
Stoploss indicatorGood for setting trailing stops and stoplosses when your taking a scalp etc, most recommended for manual trailing stops
Dynamic Ratchet Trend Strategy [VIX Filter]Overview This strategy is a long-only trend-following system designed to capture major market moves while strictly managing downside risk through a state-machine based "Ratchet" exit logic. It incorporates a volatility filter using the CBOE VIX index to stay out of (or exit) the market during high-stress environments.
Key Features
1. Multi-Condition Entries The strategy looks for momentum shifts and trend breakouts using four Simple Moving Averages (25, 50, 100, 200).
Momentum Cross: SMA 25 crossover above SMA 50.
Trend Breakouts: A specific "3-Bar Breakout" logic above the SMA 50, 100, or 200. This requires the price to hold above the SMA for 3 consecutive bars after being below it, reducing false signals compared to simple closes.
2. VIX Volatility Filter Before entering any trade, the script checks the CBOE:VIX.
Filter: If VIX is above the threshold (default 32), new entries are blocked.
Panic Exit: If you are in a position and the VIX spikes above the threshold, the strategy executes an immediate "Panic Exit" to preserve capital during market crashes.
3. The "Ratchet" Exit System (3 Stages) Unlike a standard trailing stop, this strategy uses a 3-stage dynamic exit mechanism that tightens as profits grow:
Stage 0 (Initial Risk): Standard percentage-based Stop Loss from the entry price.
Stage 1 (The Lock-In): Triggered when profit hits 10% (configurable).
Unique Logic: Instead of trailing from the highest high, the stop is calculated based on the price at the exact moment this stage was triggered. It "steps up" once and holds, securing the initial move without being prematurely stopped out by normal volatility.
Stage 2 (Trailing Mode): Triggered when profit hits 15% (configurable).
The strategy switches to a classic Trailing Stop, following the percentage distance from the Highest High.
4. Emergency Backup A "Dead Cross" (SMA 25 crossing under SMA 50) acts as a final fail-safe to close positions if the trend reverses completely before hitting a stop.
Settings & Inputs
SMAs: Customize the lengths for all four moving averages.
VIX Filter: Toggle the filter on/off and set the panic threshold.
Exit Logic: Fully customizable percentages for Initial SL, Stage 1 Trigger/Distance, and Stage 2 Trigger/Trailing Distance.
Disclaimer This script is for educational purposes only. Past performance is not indicative of future results. Always manage your risk appropriately.

PivotBoss VWAP Bands (Auto TF) - FixedWhat this indicator shows (high level)
The indicator plots a VWAP line and three bands above (R1, R2, R3) and three bands below (S1, S2, S3).
Band spacing is computed from STD(abs(VWAP − price), N) and multiplied by 1, 2 and 3 to form R1–R3 / S1–S3. The script is timeframe-aware: on 30m/1H charts it uses Weekly VWAP and weekly bands; on Daily charts it uses Monthly VWAP and monthly bands; otherwise it uses the session/chart VWAP.
VWAP = the market’s volume-weighted average price (a measure of fair value). Bands = volatility-scaled zones around that fair value.
Trading idea — concept summary
VWAP = fair value. Price above VWAP implies bullish bias; below VWAP implies bearish bias.
Bands = graded overbought/oversold zones. R1/S1 are near-term limits, R2/S2 are stronger, R3/S3 are extreme.
Use trend alignment + price action + volume to choose higher-probability trades. VWAP bands give location and magnitude; confirmations reduce false signals.
Entry rules (multiple strategies with examples)
A. Momentum breakout (trend-following) — preferred on trending markets
Setup: Price consolidates near or below R1 and then closes above R1 with above-average volume. Chart: 30m/1H (Weekly VWAP) or Daily (Monthly VWAP) depending on your timeframe.
Entry: Enter long at the close of the breakout bar that closes above R1.
Stop-loss: Place initial stop below the higher of (VWAP or recent swing low). Example: if price broke R1 at ₹1,200 and VWAP = ₹1,150, set stop at ₹1,145 (5 rupee buffer below VWAP) or below the last swing low if that is wider.
Target: Partial target at R2, full target at R3. Trail stop to VWAP or to R1 after price reaches R2.
Example numeric: Weekly VWAP = ₹1,150, R1 = ₹1,200, R2 = ₹1,260. Buy at ₹1,205 (close above R1), stop ₹1,145, target1 ₹1,260 (R2), target2 ₹1,320 (R3).
B. Mean-reversion fade near bands — for range-bound markets
Setup: Market is not trending (VWAP flatish). Price rallies up to R2 or R3 and shows rejection (pin bar, bearish engulfing) on increasing or neutral volume.
Entry: Enter short after a confirmed rejection candle that fails to sustain above R2 or R3 (prefer confirmation: close back below R1 or below the rejection candle low).
Stop-loss: Just above the recent high (e.g., 1–2 ATR or a fixed buffer above R2/R3).
Target: First target VWAP, second target S1. Reduce size if taking R3 fade as it’s an extreme.
Example numeric: VWAP = ₹950, R2 = ₹1,020. Price spikes to ₹1,025 and forms a bearish engulfing candle. Enter short at ₹1,015 after the next close below ₹1,020. Stop at ₹1,035, target VWAP ₹950.
C. Pullback entries in trending markets — higher probability
Setup: Price is above VWAP and trending higher (higher highs and higher lows). Price pulls back toward VWAP or S1 with decreasing downside volume and a reversal candle forms.
Entry: Long when price forms a bullish reversal (hammer/inside-bar) with a close back above the pullback candle.
Stop-loss: Below the pullback low (or below S2 if a larger stop is justified).
Target: VWAP then R1; if momentum resumes, trail toward R2/R3.
Example numeric: Price trending above Weekly VWAP at ₹1,400; pullback to S1 at ₹1,360. Enter long at ₹1,370 when a bullish candle closes; stop at ₹1,350; first target VWAP ₹1,400, second target R1 ₹1,450.
Exit rules and money management
Basic exit hierarchy
Hard stop exit — when price hits initial stop-loss. Always use.
Target exit — take partial profits at R1/R2 (for longs) or S1/S2 (for shorts). Use trailing stops for the remainder.
VWAP invalidation — if you entered long above VWAP and price returns and closes significantly below VWAP, consider exiting (condition depends on timeframe and trade size).
Price action exit — reversal patterns (strong opposite candle, bearish/bullish engulfing) near targets or beyond signals to exit.
Trailing rules
After price reaches R2, move stop to breakeven + a small buffer or to VWAP.
After price reaches R3, trail by 1 ATR or lock a defined profit percentage.
Position sizing & risk
Risk per trade: commonly 0.5–2% of account equity.
Determine position size by RiskAmount ÷ (EntryPrice − StopPrice).
If the stop distance is large (e.g., trading R3 fades), reduce position size.
Filters & confirmation (to reduce false signals)
Volume filter: For breakouts, require volume above short-term average (e.g., >20-period average). Breakouts on low volume are suspect.
Trend filter: Only take breakouts in the direction of the higher-timeframe trend (for example, use Daily/Weekly trend when trading 30m/1H).
Candle confirmation: Prefer entries on close of the confirming candle (not intrabar noise).
Multiple confirmations: When R1 break happens but RSI/plotted momentum indicator does not confirm, treat signal as lower probability.
Special considerations for timeframe-aware logic
On 30m/1H the script uses Weekly VWAP/bands. That means band levels change only on weekly candles — they are strong, structural levels. Treat R1/R2/R3 as significant and expect fewer, stronger signals.
On Daily, the script uses Monthly VWAP/bands. These are wider; trades should allow larger stops and smaller position sizes (or be used for swing trades).
On other intraday charts you get session VWAP (useful for intraday scalps).
Example: If you trade 1H and the Weekly R1 is at ₹2,400 while session VWAP is ₹2,350, a close above Weekly R1 represents a weekly-level breakout — prefer that for swing entries rather than scalps.
Example trade walkthrough (step-by-step)
Context: 1H chart, auto-mapped → Weekly VWAP used.
Weekly VWAP = ₹3,000; R1 = ₹3,080; R2 = ₹3,150.
Price consolidates below R1. A large bullish candle closes at ₹3,085 with volume 40% above the 20-bar average.
Entry: Buy at close ₹3,085.
Stop: Place stop at ₹2,995 (just under Weekly VWAP). Risk = ₹90.
Position size: If risking ₹900 per trade → size = 900 ÷ 90 = 10 units.
Targets: Partial take-profit at R2 = ₹3,150; rest trailed with stop moved to breakeven after R2 is hit.
If price reverses and closes below VWAP within two bars, exit immediately to limit drawdown.
When to avoid trading these signals
High-impact news (earnings, macro announcements) that can gap through bands unpredictably.
Thin markets with low volume — VWAP loses significance when volumes are extremely low.
When weekly/monthly bands are flat but intraday price is volatile without clear structure — prefer session VWAP on smaller timeframes.
Alerts & automation suggestions
Alert on close above R1 / below S1 (use the built-in alertcondition the script adds). For higher-confidence alerts, require volume filter in the alert condition.
Automated order rules (if you automate): use limit entry at breakout close plus a small slippage buffer, immediate stop order, and OCO for TP and SL.

Victoria Overlay - HTF 200 + VWAP + ATR Stop + MA TrioConsolidated road to minions
Buy Setup:
EMA1 crosses above SMA3.
RSI confirms above 50.
Volume increasing (confirming momentum).
Candle closes above SMA1 base.
Sell Setup:
EMA1 crosses below SMA3.
RSI drops below 50 or exits overbought.
Volume confirms (declining or reversing).
Candle closes below SMA1 base.
Tips:
Think of EMA1 as the scalper’s trigger.
SMA3 is your momentum check.
SMA1 (base) = short-term bias.
Avoid entries during low-volume chop.
Use for day trades or tight scalps; exits happen fast.
Overlay (Smoothed Heikin Ashi + Swing + VWAP + ATR Stop + 200-SMA)
Purpose: Multi-layer trend confirmation + clean structure.
Type: Swing alignment tool.
🟩 BUY / CALL Conditions
Green “Buy (Gated)” arrow appears.
Price is above VWAP, above 200-SMA, and above ATR stop.
ATR stop (green line) sits under price → support confirmed.
Heikin-Ashi candles are green/lime.
Bias label says “Above VWAP | Above 200 | Swing Up”.
🟥 SELL / PUT Conditions
Red “Sell (Gated)” arrow appears.
Price is below VWAP, below 200-SMA, and below ATR stop.
ATR stop (red line) sits above price → resistance confirmed.
Heikin-Ashi candles are red.
Bias label says “Below VWAP | Below 200 | Swing Down”.
Exit / Risk Control:
Close position when price crosses ATR stop.
If Heikin candles flip color, momentum is reversing.
Best Use Cases:
For next-day or multi-hour swing entries.
Use ATR Stop for dynamic stop loss.
Stay out when the bias label is mixed (e.g. “Above VWAP | Below 200 | Swing Down”).
Pro Tip:
On big news days, let VWAP reset post-open before acting on arrows — filters fake signals.
RSI Panel Pro (v6)
Purpose: Strength + exhaustion confirmation.
Type: Momentum filter.
Key Levels:
Overbought: 80+ → take profits soon.
Oversold: 20– → watch for bounce setups.
Bull regime: RSI above 60 = momentum strong.
Bear regime: RSI below 40 = weakness.
Buy / Entry Signals:
RSI crosses up from below 40 or 20.
RSI line is above RSI-EMA (gray line).
Higher timeframe RSI (if used) is also rising.
Trim / Exit:
RSI drops under 60 after being strong.
RSI crosses below its EMA.
Sell / Put Setup:
RSI fails at 60 or drops below 40.
RSI crosses under EMA after a bounce.
Tips:
Pair RSI panel with Victoria Overlay — only take gated buys when RSI confirms.
RSI < 40 but above 20 = “loading zone” for reversals.
RSI > 70 = overextended → wait for confirmation before entering.
Combined Execution Rules
Goal What to Watch Action
Entry (CALL) EMA1 > SMA3, Buy (Gated) arrow, RSI rising > 50 Buy call / open long
Entry (PUT) EMA1 < SMA3, Sell (Gated) arrow, RSI < 50 Buy put / open short
Exit Early Price crosses ATR stop or RSI flips under EMA Exit trade / protect gains
Trend Filter VWAP + 200-SMA alignment Only trade in that direction
Avoid Trades Conflicting bias label or low volume Stay flat
Pro Tips
VWAP → Intraday mean: above = bullish control, below = bearish control.
ATR Stop → Dynamic trailing stop: never widen it manually.
Smoothed Heikin-Ashi → filters noise: trend stays until color flips twice.
RSI Panel → confirms whether to hold through pullbacks.
If RSI and Overlay disagree — wait, not trade.

Mutanabby_AI | ATR+ | Trend-Following StrategyThis document presents the Mutanabby_AI | ATR+ Pine Script strategy, a systematic approach designed for trend identification and risk-managed position entry in financial markets. The strategy is engineered for long-only positions and integrates volatility-adjusted components to enhance signal robustness and trade management.
Strategic Design and Methodological Basis
The Mutanabby_AI | ATR+ strategy is constructed upon a foundation of established technical analysis principles, with a focus on objective signal generation and realistic trade execution.
Heikin Ashi for Trend Filtering: The core price data is processed via Heikin Ashi (HA) methodology to mitigate transient market noise and accentuate underlying trend direction. The script offers three distinct HA calculation modes, allowing for comparative analysis and validation:
Manual Calculation: Provides a transparent and deterministic computation of HA values.
ticker.heikinashi(): Utilizes TradingView's built-in function, employing confirmed historical bars to prevent repainting artifacts.
Regular Candles: Allows for direct comparison with standard OHLC price action.
This multi-methodological approach to trend smoothing is critical for robust signal generation.
Adaptive ATR Trailing Stop: A key component is the Average True Range (ATR)-based trailing stop. ATR serves as a dynamic measure of market volatility. The strategy incorporates user-defined parameters (
Key Value and ATR Period) to calibrate the sensitivity of this trailing stop, enabling adaptation to varying market volatility regimes. This mechanism is designed to provide a dynamic exit point, preserving capital and locking in gains as a trend progresses.
EMA Crossover for Signal Generation: Entry and exit signals are derived from the interaction between the Heikin Ashi derived price source and an Exponential Moving Average (EMA). A crossover event between these two components is utilized to objectively identify shifts in momentum, signaling potential long entry or exit points.
Rigorous Stop Loss Implementation: A critical feature for risk mitigation, the strategy includes an optional stop loss. This stop loss can be configured as a percentage or fixed point deviation from the entry price. Importantly, stop loss execution is based on real market prices, not the synthetic Heikin Ashi values. This design choice ensures that risk management is grounded in actual market liquidity and price levels, providing a more accurate representation of potential drawdowns during backtesting and live operation.
Backtesting Protocol: The strategy is configured for realistic backtesting, employing fill_orders_on_standard_ohlc=true to simulate order execution at standard OHLC prices. A configurable Date Filter is included to define specific historical periods for performance evaluation.
Data Visualization and Metrics: The script provides on-chart visual overlays for buy/sell signals, the ATR trailing stop, and the stop loss level. An integrated information table displays real-time strategy parameters, current position status, trend direction, and key price levels, facilitating immediate quantitative assessment.
Applicability
The Mutanabby_AI | ATR+ strategy is particularly suited for:
Cryptocurrency Markets: The inherent volatility of assets such as #Bitcoin and #Ethereum makes the ATR-based trailing stop a relevant tool for dynamic risk management.
Systematic Trend Following: Individuals employing systematic methodologies for trend capture will find the objective signal generation and rule-based execution aligned with their approach.
Pine Script Developers and Quants: The transparent code structure and emphasis on realistic backtesting provide a valuable framework for further analysis, modification, and integration into broader quantitative models.
Automated Trading Systems: The clear, deterministic entry and exit conditions facilitate integration into automated trading environments.
Implementation and Evaluation
To evaluate the Mutanabby_AI | ATR+ strategy, apply the script to your chosen chart on TradingView. Adjust the input parameters (Key Value, ATR Period, Heikin Ashi Method, Stop Loss Settings) to observe performance across various asset classes and timeframes. Comprehensive backtesting is recommended to assess the strategy's historical performance characteristics, including profitability, drawdown, and risk-adjusted returns.
I'd love to hear your thoughts, feedback, and any optimizations you discover! Drop a comment below, give it a like if you find it useful, and share your results.

Range Filter + ATR Strategy (Low Drawdown)Key Features for Low Drawdown:
Range Filter: Identifies trends while filtering out market noise
ATR-based Position Sizing: Adjusts position size based on volatility to risk a fixed percentage of capital
Trailing Stops: Uses ATR-based trailing stops to lock in profits and limit losses
Conservative Risk Parameters: Defaults to 1% risk per trade (adjustable)
Trend Confirmation: Requires two consecutive closes above/below the range filter
How to Use:
The strategy enters long when price is above the upper range filter for two consecutive bars
Enters short when price is below the lower range filter for two consecutive bars
Uses ATR to size positions appropriately for current volatility
Implements trailing stops based on ATR to protect profits
Optimization Tips:
Adjust the Range Filter period based on your timeframe
Modify the risk percentage (1% is conservative)
Tweak the ATR multiple for trailing stops (1.5 is moderate)
Consider adding a time-based exit if drawdown is still too high

nineLivesUtilLibLibrary "nineLivesUtilLib"
isDateInRange(currentTime, useTimeFilter, startDate, endDate)
Checks if the current time is within the specified date range.
Parameters:
currentTime (int) : The current bar's time (time).
useTimeFilter (bool) : Bool 📅: Enable the date range filter.
startDate (int) : Timestamp 📅: The start date for the filter.
endDate (int) : Timestamp 📅: The end date for the filter.
Returns: True if the current time is within the range or filtering is disabled, false otherwise.
@example
inDateRange = nineLivesUtilLib.isDateInRange(time, useTimeFilter, startDate, endDate)
if inDateRange
// Execute trading logic
checkVolumeCondition(currentVolume, useVolumeFilter, volumeThresholdMultiplier, volumeLength)
Checks if the current volume meets the threshold condition.
Parameters:
currentVolume (float) : The current bar's volume (volume).
useVolumeFilter (bool) : Bool 📊: Enable the volume filter.
volumeThresholdMultiplier (float) : Float 📊: Volume threshold relative to average (e.g., 1.5 for 1.5x average).
volumeLength (int) : Int 📊: Lookback length for the volume average.
Returns: True if the volume condition is met or filtering is disabled, false otherwise.
@example
volumeOk = nineLivesUtilLib.checkVolumeCondition(volume, useVolumeFilter, volumeThreshold, volumeLength)
if volumeOk
// Proceed with trading logic
checkMultiTimeframeCondition(currentClose, currentOpen, htfClose, htfOpen, useMultiTimeframe, alignment)
Checks alignment with higher timeframe direction.
Parameters:
currentClose (float) : Float: The current bar's closing price (close).
currentOpen (float) : Float: The current bar's opening price (open).
htfClose (float) : Float: The closing price from the higher timeframe (must be fetched by the calling script using request.security).
htfOpen (float) : Float: The opening price from the higher timeframe (must be fetched by the calling script using request.security).
useMultiTimeframe (bool) : Bool ⏱️: Enable multi-timeframe analysis.
alignment (string) : String ⏱️: Desired alignment ("same", "opposite", "any").
Returns: True if the timeframe alignment condition is met or analysis is disabled, false otherwise.
@example
// In the calling script:
= request.security(syminfo.tickerid, higherTimeframe, )
tfOk = nineLivesUtilLib.checkMultiTimeframeCondition(close, open, htfClose, htfOpen, useMultiTimeframe, tfAlignment)
if tfOk
// Proceed with trading logic
checkMarketRegime(useMarketRegime, regimeIndicator, regimeThreshold, regimeLength, regimeMode)
Detects the market regime (trending or ranging) and checks if trading is allowed.
Parameters:
useMarketRegime (bool) : Bool 🔍: Enable market regime detection.
regimeIndicator (string) : String 🔍: Indicator to use ("ADX" or "Volatility").
regimeThreshold (int) : Int 🔍: Threshold for trend strength/volatility.
regimeLength (simple int) : Int 🔍: Lookback length for the indicator.
regimeMode (string) : String 🔍: Trading mode based on regime ("trend_only", "range_only", "adaptive").
Returns: A tuple containing:
: conditionMet (bool) - True if trading is allowed based on the regime mode and detection, false otherwise.
: inTrendingRegime (bool) - True if the current regime is trending based on the indicator and threshold.
@example
= nineLivesUtilLib.checkMarketRegime(useMarketRegime, regimeIndicator, regimeThreshold, regimeLength, regimeMode)
if regimeOk
// Proceed with trading logic
applyCooldown(buySignal, sellSignal, cooldownBars)
Applies a cooldown period after a signal.
Parameters:
buySignal (bool) : Bool: Buy signal (potentially after primary entry logic).
sellSignal (bool) : Bool: Sell signal (potentially after primary entry logic).
cooldownBars (int) : Int ⏳: The number of bars to wait after a signal before allowing another.
Returns: A tuple containing:
: cooldownFilteredBuy (bool) - Buy signal after cooldown filter.
: cooldownFilteredSell (bool) - Sell signal after cooldown filter.
@example
= nineLivesUtilLib.applyCooldown(rawBuySignal, rawSellSignal, iCool)
applyAllFilters(rawBuy, rawSell, inDateRange, tradeDirection, volumeOk, tfOk, regimeOk, drawdownOk, cooldownOkBuy, cooldownOkSell)
Applies all filtering conditions to the buy and sell signals.
Parameters:
rawBuy (bool) : Bool: The initial buy signal candidate (from primary entry logic, e.g., after cooldown).
rawSell (bool) : Bool: The initial sell signal candidate (from primary entry logic, e.g., after cooldown).
inDateRange (bool) : Bool 📅: Result from isDateInRange.
tradeDirection (string) : String 🔄: Overall trade direction preference ("longs_only", "shorts_only", "both").
volumeOk (bool) : Bool 📊: Result from checkVolumeCondition.
tfOk (bool) : Bool ⏱️: Result from checkMultiTimeframeCondition.
regimeOk (bool) : Bool 🔍: Result from checkMarketRegime.
drawdownOk (bool) : Bool 📉: Result from checkDrawdownExceeded (or equivalent).
cooldownOkBuy (bool) : Bool ⏳: Result from applyCooldown for buy.
cooldownOkSell (bool) : Bool ⏳: Result from applyCooldown for sell.
Returns: A tuple containing:
: finalBuySignal (bool) - The final buy signal after all filters.
: finalSellSignal (bool) - The final sell signal after all filters.
@example
= nineLivesUtilLib.applyAllFilters(cooldownBuy, cooldownSell, inDateRange, tradeDirection, volumeOk, tfOk, regimeOk, !drawdownExceeded, cooldownBuy, cooldownSell)
NOTE: This function filters signals generated by your primary entry logic (e.g., EMA crossover).
checkDrawdownExceeded(currentEquity, useMaxDrawdown, maxDrawdownPercent)
Tracks maximum equity and checks if current drawdown exceeds a threshold.
Parameters:
currentEquity (float) : Float: The strategy's current equity (strategy.equity).
useMaxDrawdown (bool) : Bool 📉: Enable max drawdown protection.
maxDrawdownPercent (float) : Float 📉: The maximum allowed drawdown as a percentage.
Returns: True if drawdown protection is enabled and the current drawdown exceeds the threshold, false otherwise.
@example
drawdownExceeded = nineLivesUtilLib.checkDrawdownExceeded(strategy.equity, useMaxDrawdown, maxDrawdownPercent)
if drawdownExceeded
// Consider stopping entries or exiting positions in the strategy script
calculateExitPrice(positionAvgPrice, percentage, isStop, isLong)
Calculates a stop loss or take profit price based on a percentage from the average entry price.
Parameters:
positionAvgPrice (float) : Float: The average price of the current position (strategy.position_avg_price).
percentage (float) : Float: The stop loss or take profit percentage (e.g., 2.0 for 2%).
isStop (bool) : Bool: True if calculating a stop loss price, false if calculating a take profit price.
isLong (bool) : Bool: True if the position is long, false if short.
Returns: The calculated stop price or take profit price, or na if no position or percentage is invalid.
@example
longSL = nineLivesUtilLib.calculateExitPrice(strategy.position_avg_price, stopLossPercent, true, true)
shortTP = nineLivesUtilLib.calculateExitPrice(strategy.position_avg_price, takeProfitPercent, false, false)
calculateTrailingStopLevel(positionAvgPrice, trailOffsetPercent, trailPercent, currentHigh, currentLow, isLong)
Calculates the current trailing stop level for a position.
Parameters:
positionAvgPrice (float) : Float: The average price of the current position (strategy.position_avg_price).
trailOffsetPercent (float) : Float 🔄: The percentage price movement to activate the trailing stop.
trailPercent (float) : Float 🔄: The percentage distance the stop trails behind the price.
currentHigh (float) : Float: The current bar's high (high).
currentLow (float) : Float: The current bar's low (low).
isLong (bool) : Bool: True if the position is long, false if short.
Returns: The calculated trailing stop price if active, otherwise na.
@example
longTrailStop = nineLivesUtilLib.calculateTrailingStopLevel(strategy.position_avg_price, trailOffset, trailPercent, high, low, true)
shortTrailStop = nineLivesUtilLib.calculateTrailingStopLevel(strategy.position_avg_price, trailOffset, trailPercent, high, low, false)
if not na(longTrailStop)
strategy.exit("Long Trail", from_entry="Long", stop=longTrailStop)
Moving Average Shift WaveTrend StrategyMoving Average Shift WaveTrend Strategy
🧭 Overview
The Moving Average Shift WaveTrend Strategy is a trend-following and momentum-based trading system designed to be overlayed on TradingView charts. It executes trades based on the confluence of multiple technical conditions—volatility, session timing, trend direction, and oscillator momentum—to deliver logical and systematic trade entries and exits.
🎯 Strategy Objectives
Enter trades aligned with the prevailing long-term trend
Exit trades on confirmed momentum reversals
Avoid false signals using session timing and volatility filters
Apply structured risk management with automatic TP, SL, and trailing stops
⚙️ Key Features
Selectable MA types: SMA, EMA, SMMA (RMA), WMA, VWMA
Dual-filter logic using a custom oscillator and moving averages
Session and volatility filters to eliminate low-quality setups
Trailing stop, configurable Take Profit / Stop Loss logic
“In-wave flag” prevents overtrading within the same trend wave
Visual clarity with color-shifting candles and entry/exit markers
📈 Trading Rules
✅ Long Entry Conditions:
Price is above the selected MA
Oscillator is positive and rising
200-period EMA indicates an uptrend
ATR exceeds its median value (sufficient volatility)
Entry occurs between 09:00–17:00 (exchange time)
Not currently in an active wave
🔻 Short Entry Conditions:
Price is below the selected MA
Oscillator is negative and falling
200-period EMA indicates a downtrend
All other long-entry conditions are inverted
❌ Exit Conditions:
Take Profit or Stop Loss is hit
Opposing signals from oscillator and MA
Trailing stop is triggered
🛡️ Risk Management Parameters
Pair: ETH/USD
Timeframe: 4H
Starting Capital: $3,000
Commission: 0.02%
Slippage: 2 pips
Risk per Trade: 2% of account equity (adjustable)
Total Trades: 224
Backtest Period: May 24, 2016 — April 7, 2025
Note: Risk parameters are fully customizable to suit your trading style and broker conditions.
🔧 Trading Parameters & Filters
Time Filter: Trades allowed only between 09:00–17:00 (exchange time)
Volatility Filter: ATR must be above its median value
Trend Filter: Long-term 200-period EMA
📊 Technical Settings
Moving Average
Type: SMA
Length: 40
Source: hl2
Oscillator
Length: 15
Threshold: 0.5
Risk Management
Take Profit: 1.5%
Stop Loss: 1.0%
Trailing Stop: 1.0%
👁️ Visual Support
MA and oscillator color changes indicate directional bias
Clear chart markers show entry and exit points
Trailing stops and risk controls are transparently managed
🚀 Strategy Improvements & Uniqueness
In-wave flag avoids repeated entries within the same trend phase
Filtering based on time, volatility, and trend ensures higher-quality trades
Dynamic high/low tracking allows precise trailing stop placement
Fully rule-based execution reduces emotional decision-making
💡 Inspirations & Attribution
This strategy is inspired by the excellent concept from:
ChartPrime – “Moving Average Shift”
It expands on the original idea with advanced trade filters and trailing logic.
Source reference:
📌 Summary
The Moving Average Shift WaveTrend Strategy offers a rule-based, reliable approach to trend trading. By combining trend and momentum filters with robust risk controls, it provides a consistent framework suitable for various market conditions and trading styles.
⚠️ Disclaimer
This script is for educational purposes only. Trading involves risk. Always use proper backtesting and risk evaluation before applying in live markets.

Heiken Ashi Supertrend ADXHeiken Ashi Supertrend ADX Indicator
Overview
This indicator combines the power of Heiken Ashi candles, Supertrend indicator, and ADX filter to identify strong trend movements across multiple timeframes. Designed primarily for the cryptocurrency market but adaptable to any tradable asset, this system focuses on capturing momentum in established trends while employing a sophisticated triple-layer stop loss mechanism to protect capital and secure profits.
Strategy Mechanics
Entry Signals
The strategy uses a unique blend of technical signals to identify high-probability trade entries:
Heiken Ashi Candles: Looks specifically for Heiken Ashi candles with minimal or no wicks, which signal strong momentum and trend continuation. These "full-bodied" candles represent periods where price moved decisively in one direction with minimal retracement. These are overlayed onto normal candes for more accuarte signalling and plotting
Supertrend Filter: Confirms the underlying trend direction using the Supertrend indicator (default factor: 3.0, ATR period: 10). Entries are aligned with the prevailing Supertrend direction.
ADX Filter (Optional) : Can be enabled to focus only on stronger trending conditions, filtering out choppy or ranging markets. When enabled, trades only trigger when ADX is above the specified threshold (default: 25).
Exit Signals
Positions are closed when either:
An opposing signal appears (Heiken Ashi candle with no wick in the opposite direction)
Any of the three stop loss mechanisms are triggered
Triple-Layer Stop Loss System
The strategy employs a sophisticated three-tier stop loss approach:
ATR Trailing Stop: Adapts to market volatility and locks in profits as the trend extends. This stop moves in the direction of the trade, capturing profit without exiting too early during normal price fluctuations.
Swing Point Stop: Uses natural market structure (recent highs/lows over a lookback period) to place stops at logical support/resistance levels, honoring the market's own rhythm.
Insurance Stop: A percentage-based safety net that protects against sudden adverse moves immediately after entry. This is particularly valuable when the swing point stop might be positioned too far from entry, providing immediate capital protection.
Optimization Features
Customizable Filters : All components (Supertrend, ADX) can be enabled/disabled to adapt to different market conditions
Adjustable Parameters : Fine-tune ATR periods, Supertrend factors, and ADX thresholds
Flexible Stop Loss Settings : Each of the three stop loss mechanisms can be individually enabled/disabled with customizable parameters
Best Practices for Implementation
[Recommended Timeframes : Works best on 4-hour charts and above, where trends develop more reliably
Market Conditions: Performs well across various market conditions due to the ADX filter's ability to identify meaningful trends
Performance Characteristics
When properly optimized, this has demonstrated profit factors exceeding 3 in backtesting. The approach typically produces generous winners while limiting losses through its multi-layered stop loss system. The ATR trailing stop is particularly effective at capturing extended trends, while the insurance stop provides immediate protection against adverse moves.
The visual components on the chart make it easy to follow the strategy's logic, with position status, entry prices, and current stop levels clearly displayed.
This indicator represents a complete trading system with clearly defined entry and exit rules, adaptive stop loss mechanisms, and built-in risk management through position sizing.

Heiken Ashi Supertrend ADX - StrategyHeiken Ashi Supertrend ADX Strategy
Overview
This strategy combines the power of Heiken Ashi candles, Supertrend indicator, and ADX filter to identify strong trend movements across multiple timeframes. Designed primarily for the cryptocurrency market but adaptable to any tradable asset, this system focuses on capturing momentum in established trends while employing a sophisticated triple-layer stop loss mechanism to protect capital and secure profits.
Strategy Mechanics
Entry Signals
The strategy uses a unique blend of technical signals to identify high-probability trade entries:
Heiken Ashi Candles: Looks specifically for Heiken Ashi candles with minimal or no wicks, which signal strong momentum and trend continuation. These "full-bodied" candles represent periods where price moved decisively in one direction with minimal retracement.
Supertrend Filter : Confirms the underlying trend direction using the Supertrend indicator (default factor: 3.0, ATR period: 10). Entries are aligned with the prevailing Supertrend direction.
ADX Filter (Optional) : Can be enabled to focus only on stronger trending conditions, filtering out choppy or ranging markets. When enabled, trades only trigger when ADX is above the specified threshold (default: 25).
Exit Signals
Positions are closed when either:
An opposing signal appears (Heiken Ashi candle with no wick in the opposite direction)
Any of the three stop loss mechanisms are triggered
Triple-Layer Stop Loss System
The strategy employs a sophisticated three-tier stop loss approach:
ATR Trailing Stop: Adapts to market volatility and locks in profits as the trend extends. This stop moves in the direction of the trade, capturing profit without exiting too early during normal price fluctuations.
Swing Point Stop : Uses natural market structure (recent highs/lows over a lookback period) to place stops at logical support/resistance levels, honoring the market's own rhythm.
Insurance Stop: A percentage-based safety net that protects against sudden adverse moves immediately after entry. This is particularly valuable when the swing point stop might be positioned too far from entry, providing immediate capital protection.
Optimization Features
Customizable Filters: All components (Supertrend, ADX) can be enabled/disabled to adapt to different market conditions
Adjustable Parameters: Fine-tune ATR periods, Supertrend factors, and ADX thresholds
Flexible Stop Loss Settings: Each of the three stop loss mechanisms can be individually enabled/disabled with customizable parameters
Best Practices for Implementation
Recommended Timeframes: Works best on 4-hour charts and above, where trends develop more reliably
Market Conditions: Performs well across various market conditions due to the ADX filter's ability to identify meaningful trends
Position Sizing: The strategy uses a percentage of equity approach (default: 3%) for position sizing
Performance Characteristics
When properly optimized, this strategy has demonstrated profit factors exceeding 3 in backtesting. The approach typically produces generous winners while limiting losses through its multi-layered stop loss system. The ATR trailing stop is particularly effective at capturing extended trends, while the insurance stop provides immediate protection against adverse moves.
The visual components on the chart make it easy to follow the strategy's logic, with position status, entry prices, and current stop levels clearly displayed.
This strategy represents a complete trading system with clearly defined entry and exit rules, adaptive stop loss mechanisms, and built-in risk management through position sizing.

Reversal Trading Bot Strategy[BullByte]Overview :
The indicator Reversal Trading Bot Strategy is crafted to capture potential market reversal points by combining momentum, volatility, and trend alignment filters. It uses a blend of technical indicators to identify both bullish and bearish reversal setups, ensuring that multiple market conditions are met before entering a trade.
Core Components :
Technical Indicators Used :
RSI (Relative Strength Index) :
Purpose : Detects divergence conditions by comparing recent lows/highs in price with the RSI.
Parameter : Length of 8.
Bollinger Bands (BB) :
Purpose : Measures volatility and identifies price levels that are statistically extreme.
Parameter : Length of 20 and a 2-standard deviation multiplier.
ADX (Average Directional Index) & DMI (Directional Movement Index) :
Purpose : Quantifies the strength of the trend. The ADX threshold is set at 20, and additional filters check for the alignment of the directional indicators (DI+ and DI–).
ATR (Average True Range) :
Purpose : Provides a volatility measure used to set stop levels and determine risk through trailing stops.
Volume SMA (Simple Moving Average of Volume ):
Purpose : Helps confirm strength by comparing the current volume against a 20-period average, with an optional filter to ensure volume is at least twice the SMA.
User-Defined Toggle Filters :
Volume Filter : Confirms that the volume is above average (or twice the SMA) before taking trades.
ADX Trend Alignment Filter : Checks that the ADX’s directional indicators support the trade direction.
BB Close Confirmation : Optionally refines the entry by requiring price to be beyond the upper or lower Bollinger Band rather than just above or below.
RSI Divergence Exit : Allows the script to close positions if RSI divergence is detected.
BB Mean Reversion Exit : Closes positions if the price reverts to the Bollinger Bands’ middle line.
Risk/Reward Filter : Ensures that the potential reward is at least twice the risk by comparing the distance to the Bollinger Band with the ATR.
Candle Movement Filter : Optional filter to require a minimum percentage move in the candle to confirm momentum.
ADX Trend Exit : Closes positions if the ADX falls below the threshold and the directional indicators reverse.
Entry Conditions :
Bullish Entry :
RSI Divergence : Checks if the current close is lower than a previous low while the RSI is above the previous low, suggesting bullish divergence.
Bollinger Confirmation : Requires that the price is above the lower (or upper if confirmation is toggled) Bollinger Band.
Volume & Trend Filters : Combines volume condition, ADX strength, and an optional candle momentum condition.
Risk/Reward Check : Validates that the trade meets a favorable risk-to-reward ratio.
Bearish Entry :
Uses a mirror logic of the bullish entry by checking for bearish divergence, ensuring the price is below the appropriate Bollinger level, and confirming volume, trend strength, candle pattern, and risk/reward criteria.
Trade Execution and Exit Strateg y:
Trade Execution :
Upon meeting the entry conditions, the strategy initiates a long or short position.
Stop Loss & Trailing Stops :
A stop-loss is dynamically set using the ATR value, and trailing stops are implemented as a percentage of the close price.
Exit Conditions :
Additional exit filters can trigger early closures based on RSI divergence, mean reversion (via the middle Bollinger Band), or a weakening trend as signaled by ADX falling below its threshold.
This multi-layered exit strategy is designed to lock in gains or minimize losses if the market begins to reverse unexpectedly.
How the Strategy Works in Different Market Conditions :
Trending Markets :
The ADX filter ensures that trades are only taken when the trend is strong. When the market is trending, the directional movement indicators help confirm the momentum, making the reversal signal more reliable.
Ranging Markets :
In choppy markets, the Bollinger Bands expand and contract, while the RSI divergence can highlight potential turning points. The optional filters can be adjusted to avoid false signals in low-volume or low-volatility conditions.
Volatility Management :
With ATR-based stop-losses and a risk/reward filter, the strategy adapts to current market volatility, ensuring that risk is managed consistently.
Recommendation on using this Strategy with a Trading Bot :
This strategy is well-suited for high-frequency trading (HFT) due to its ability to quickly identify reversal setups and execute trades dynamically with automated stop-loss and trailing exits. By integrating this script with a TradingView webhook-based bot or an API-driven execution system, traders can automate trade entries and exits in real-time, reducing manual execution delays and capitalizing on fast market movements.
Disclaimer :
This script is provided for educational and informational purposes only. It is not intended as investment advice. Trading involves significant risk, and you should always conduct your own research and analysis before making any trading decisions. The author is not responsible for any losses incurred while using this script.

Options Series - P_SAR And Supertrend
The provided PineScript combines two well-known indicators—Parabolic SAR (P_SAR) and Supertrend—to create a comprehensive trading tool. Here are some powerful insights and the importance of this script:
⭐ 1. Supertrend Indicator:
What it does: The Supertrend indicator is based on the Average True Range (ATR) and is used to identify trend direction. When the price is above the Supertrend line, it suggests an uptrend, and when below, a downtrend.
Insights:
Trend Following: By adjusting the ATR length (atrPeriod) and the multiplier (factor), you can fine-tune the sensitivity of the Supertrend. A smaller ATR or factor results in more frequent trend changes, whereas larger values make the indicator more robust but slower to react.
Trend Visualization: The script highlights trends with the help of green and red lines, offering a clear visual cue for traders. The uptrend is filled with a translucent green and the downtrend with red, allowing quick identification of market momentum.
⭐ 2. Parabolic SAR (P_SAR):
What it does: The Parabolic SAR is a time/price-based indicator that helps identify potential reversals in the market. The dots (SAR) follow the price and move closer to it as the trend progresses.
Insights:
Trailing Stops: This is commonly used by traders to trail stop losses, as the SAR moves closer to price as the trend strengthens.
Combining with Supertrend: The SAR dots in this script act as an additional confirmation for trend direction. For instance, when the price is above both the SAR and Supertrend, it strongly suggests an uptrend.
⭐ 3. Bar Coloring Based on Trend Confirmation:
What it does: The script calculates conditions based on whether the price is above or below both the Supertrend and SAR values.
Insights:
Bullish/Bearish Confirmation: The combination of these two indicators provides a stronger confirmation of trend direction compared to using either one alone. For example:
Green Bars: If the price is above both the Supertrend and SAR, it signals a strong uptrend (bullish).
Red Bars: If the price is below both, it suggests a strong downtrend (bearish).
Visual Alerts: The candle colors are adjusted based on these conditions, providing a quick visual alert for traders to take action.
⭐ 4. Importance of Using Both Supertrend and P_SAR:
Multiple Confirmations: Combining the Supertrend and Parabolic SAR increases the accuracy of trend-following strategies. Each indicator has its strengths: Supertrend is good for identifying the overall trend, while the SAR excels at identifying potential reversals.
Risk Management: This script can help you not only identify trends but also manage your positions more effectively. The Parabolic SAR, for example, can serve as a dynamic stop-loss level, while the Supertrend can help you stay in trades longer by smoothing out noise in the market.
⭐ 5. Customizable Inputs:
Adaptability: The user can adjust the ATR period, factor, start, increment, and maximum values, tailoring the script to different market conditions and timeframes. This flexibility is essential, as each asset class or market may require different parameter settings.
⭐ 6. Practical Application in Trading:
Entry and Exit Signals: The script can be used to generate entry and exit signals. For instance:
Buy Signal: When the bar turns green (price is above Supertrend and SAR), it could be a signal to go long.
Sell Signal: When the bar turns red (price is below Supertrend and SAR), it could be a signal to go short or exit a long position.
Stop-Loss Placement: The Parabolic SAR dots can act as trailing stop-loss levels, helping traders lock in profits as trends progress.
Trend Continuation vs. Reversal: The Supertrend provides a broader view of the trend, while the Parabolic SAR provides pinpoint entry/exit signals for reversals.
🚀 Conclusion:
This script is a robust combination of trend-following and reversal indicators, making it a versatile tool for traders. The dual confirmation from Supertrend and Parabolic SAR reduces false signals, and the color-coded bars provide quick insights into market conditions. When used properly, this can greatly improve your ability to catch trends early, exit at the right moment, and manage risk effectively.

Uptrick: Imbalance MA Trailing System
### **Overview**
The "Uptrick: Imbalance MA Trailing System" is a complex trading indicator designed to help traders identify potential bullish and bearish imbalances in the market, coupled with a trailing stop mechanism to manage trades. The indicator uses a combination of moving averages, Average True Range (ATR), and custom logic to detect trading signals and plot various levels on the chart to assist traders in making informed decisions.
### **Key Components and Functionality**
#### 1. **Inputs and Configuration**
- **Imbalance Filter (`imbalanceFilter`)**: This input sets the filter for detecting imbalances based on the difference between two price points. The value is a float and can be adjusted to fine-tune the sensitivity of imbalance detection. The default value is `0.0`, with a step size of `0.1`.
- **Moving Average Settings (`maLength1`, `maLength2`, `maColor1`, `maColor2`)**:
- `maLength1` and `maLength2` define the lengths of the two moving averages used in the indicator. By default, they are set to `50` and `200` periods, respectively.
- `maColor1` and `maColor2` specify the colors of these moving averages on the chart. The first MA is colored blue, and the second is red.
- **Take Profit and Stop Loss Settings (`displayTP`, `tpMultiplier`, `tpColor`, `displaySL`, `slMultiplier`, `slColor`)**:
- `displayTP` and `displaySL` are boolean inputs that control whether the TP and SL areas are displayed on the chart.
- `tpMultiplier` and `slMultiplier` are multipliers used to calculate the TP and SL levels relative to the detected imbalance level using the ATR value.
- `tpColor` and `slColor` define the colors of these areas. The TP area is green (with a transparency of 50), and the SL area is red (with a transparency of 50).
- **Trailing Stop Settings (`trailMultiplier`)**: This setting determines the multiplier used to calculate the trailing stop level based on the ATR value. The default multiplier is `2.5`.
- **Style Settings (`bullishColor`, `bearishColor`)**:
- `bullishColor` and `bearishColor` set the colors for bullish and bearish zones created when an imbalance is detected. The bullish zone is green, and the bearish zone is red.
- **Signal Label Size (`labelSizeOption`)**: The size of the signal labels displayed on the chart can be adjusted. The options include `Tiny`, `Small`, `Normal`, `Large`, and `Huge`. The selected size affects the visual prominence of the labels.
#### 2. **ATR Calculation (`atrValue`)**
- The ATR value is calculated using a period of 14, which is a standard setting for measuring market volatility. This value is used extensively throughout the indicator to calculate TP, SL, and trailing stop levels.
#### 3. **Imbalance Detection and Zone Creation**
- The indicator detects potential imbalances in the market by comparing certain price points, using a custom function (`imbalanceCondition`).
- **Bullish Imbalance Detection (`bullishSignal`)**:
- A bullish imbalance is detected when the low of three bars ago is higher than the high of one bar ago, and the current close is above the low of three bars ago.
- Additional conditions include checking that the current close is above the calculated average of the two moving averages (`ma1` and `ma2`), and that the imbalance exceeds the threshold set by the `imbalanceFilter`.
- **Bearish Imbalance Detection (`bearishSignal`)**:
- A bearish imbalance is detected under conditions where the low of one bar ago is higher than the high of three bars ago, and the current close is below the high of three bars ago.
- Like the bullish signal, the close must also be below the average of the two moving averages, and the imbalance must exceed the `imbalanceFilter` threshold.
- Upon detection of an imbalance (either bullish or bearish), the indicator creates a zone using `box.new` that highlights the price range of the imbalance. The box color corresponds to the bullish or bearish nature of the signal.
- The center of the imbalance range is marked with a dashed line, and a corresponding label (`🔴` for bearish and `🟢` for bullish) is placed on the chart to indicate the detected signal.
#### 4. **Take Profit and Stop Loss Calculation (`calculateTPSL`)**
- When an imbalance is detected, the indicator calculates potential TP and SL levels based on the ATR value and the respective multipliers.
- If the TP or SL areas are enabled, the indicator plots these areas as colored boxes on the chart.
- The function also tracks whether these levels are hit by subsequent price action, updating the status (`reached`) as appropriate.
#### 5. **Trailing Stop Logic (`applyTrailingStop`)**
- The trailing stop feature is a dynamic mechanism that adjusts the stop level as the price moves in the trader's favor.
- The trailing stop is calculated using the ATR value multiplied by the `trailMultiplier`.
- If the trailing stop is triggered (i.e., the price crosses the trailing stop level), the indicator marks the trade as stopped out.
#### 6. **Plotting and Visualization**
- The indicator plots the two moving averages on the chart with the specified colors and line width.
- If a trailing stop is active, it plots the trailing stop level on the chart, updating as the stop moves.
- The bar color changes based on the status of the current signal and whether the trailing stop or TP/SL levels have been hit.
### **Detailed Execution Flow**
1. **Initialization**: The indicator initializes several variables, including lines, boxes, and the current signal state. This setup ensures that the script can dynamically update these elements as new price data comes in.
2. **Moving Average Calculation**: The moving averages (`ma1` and `ma2`) are calculated using simple moving average (SMA) functions, which are foundational for many of the indicator's conditions.
3. **Imbalance Detection**: The script evaluates price action to detect potential bullish or bearish imbalances, applying filters based on the user-defined `imbalanceFilter`.
4. **Zone Creation and Labeling**: Upon detecting an imbalance, the script creates visual zones on the chart using the `box.new` function and labels the zones for easy identification.
5. **Take Profit and Stop Loss Logic**: The TP and SL areas are calculated and plotted if the relevant settings are enabled. The script continuously checks if these levels are reached as new bars form.
6. **Trailing Stop Calculation**: The script dynamically adjusts the trailing stop level based on the price movement and ATR value. The trailing stop helps lock in profits as the trade progresses.
7. **Plotting**: The moving averages, trailing stop levels, and bar colors are plotted on the chart, providing a visual representation of the indicator's signals and trade management levels.
8. **Final Checks and Updates**: The script concludes each bar's processing by updating the status of various elements, such as whether levels have been reached or if the trailing stop has been triggered.
### **Conclusion**
The "Uptrick: Imbalance MA Trailing System" is a highly versatile indicator designed for traders who want to identify market imbalances and manage their trades effectively using a combination of moving averages, ATR-based calculations, and custom logic. The indicator offers a wide range of customization options, allowing traders to adjust the sensitivity of imbalance detection, the size of the signal labels, and the visibility of various trade management levels (TP, SL, and trailing stop).
The combination of these features makes it a powerful tool for both novice and experienced traders, providing clear visual cues and robust trade management capabilities directly on the chart.

Targets For Overlay Indicators [LuxAlgo]The Targets For Overlay Indicators is a useful utility tool able to display targets during crossings made between the price and external indicators on the user chart. Users can display a series of two targets, one for crossover events and another one for crossunder event.
Alerts are included for the occurrence of a new target as well as for reached targets.
🔶 USAGE
In order for targets to be displayed users need to select an appropriate input source from the "Source" drop-down input setting. In the example above we apply the indicator to a volatility stop.
This can also easily be done by adding the "Targets For Overlay Indicators" script on the VStop indicator directly.
Targets can help users determine the price limit where the price might start deviating from an indication given by one or multiple indicators. In the context of trading, targets can help secure profits/reduce losses of a trade, as such this tool can be useful to evaluate/determine user take profits/stop losses.
Due to these essentially being horizontal levels, they can also serve as potential support/resistances, with breakouts potentially confirming new trends.
Users might be interested in obtaining new targets once one is reached, this can be done by enabling "New Target When Reached" in the target logic setting section, resulting in more frequent targets.
Lastly, users can restrict new target creation until current ones are reached. This can result in fewer and longer-term targets, with a higher reach rate.
🔹 Examples
The indicator can be applied to many overlay indicators that naturally produce crosses with the price, such as moving average, trailing stops, bands...etc.
Users can use trailing stops such as the SuperTrend or VStop to more easily create clean targets. Do note that certain SuperTrend scripts separate the upper and lower extremities of the SuperTrend into two different plot, which cannot be used with this tool, you may use the provided SuperTrend script below to have a compatible version with our tool:
//@version=5
indicator("SuperTrend", overlay = true)
factor = input.float(3, 'Factor', minval = 0)
atrLen = input.int(10, 'ATR Length', minval = 1)
= ta.supertrend(factor, atrLen)
plot(spt, 'SuperTrend', dir != dir ? na : dir < 0 ? #089981 : #f23645, 2)
plot(spt, 'Circles', dir > dir ? #f23645 : dir < dir ? #089981 : na, 3, plot.style_circles)
Using moving averages can produce more targets than other overlay indicators.
Users can apply the tool twice when using bands or any overlay indicator returning two outputs, using crossover targets for obtaining targets using the upper band as source and crossunder targets for targets using the lower band. We can also use the Trendlines with breaks indicator as example:
🔹 Dashboard
A dashboard is displayed on the top right of the chart, displaying the amount, reach rate of targets 1/2, and total amount.
This dashboard can be useful to evaluate the selected target distances relative to the selected conditions, with a higher reach rate suggesting the distance of the targets from the price allows them to be reached.
🔶 SETTINGS
Source: Indicator source used to create targets. Targets are created when the closing price crosses the specified source.
Show Target Labels: Display target labels on the chart.
Candle Coloring: Apply candle coloring based on the most recent active target.
🔹 Target
Crossover and Crossunder targets use the same settings below:
Show Target: Determines if the target is displayed or not.
Above Price Target: If selected, will create targets above the closing price.
Wait Until Reached: When enabled will not create a new target until an existing one is reached.
New Target When Reached: Will create a new target when an existing one is reached.
Evaluate Wicks: Will use high/low prices to determine if a target is reached. Unselecting this setting will use the closing price.
Target Distance From Price: Controls the distance of a target from the price. Can be determined in currencies/points, percentages, ATR multiples, or ticks.

AI Channels (Clustering) [LuxAlgo]The AI Channels indicator is constructed based on rolling K-means clustering, a common machine learning method used for clustering analysis. These channels allow users to determine the direction of the underlying trends in the price.
We also included an option to display the indicator as a trailing stop from within the settings.
🔶 USAGE
Each channel extremity allows users to determine the current trend direction. Price breaking over the upper extremity suggesting an uptrend, and price breaking below the lower extremity suggesting a downtrend. Using a higher Window Size value will return longer-term indications.
The "Clusters" setting allows users to control how easy it is for the price to break an extremity, with higher values returning extremities further away from the price.
The "Denoise Channels" is enabled by default and allows to see less noisy extremities that are more coherent with the detected trend.
Users who wish to have more focus on a detected trend can display the indicator as a trailing stop.
🔹 Centroid Dispersion Areas
Each extremity is made of one area. The width of each area indicates how spread values within a cluster are around their centroids. A wider area would suggest that prices within a cluster are more spread out around their centroid, as such one could say that it is indicative of the volatility of a cluster.
Wider areas around a specific extremity can indicate a larger and more spread-out amount of prices within the associated cluster. In practice price entering an area has a higher chance to break an associated extremity.
🔶 DETAILS
The indicator performs K-means clustering over the most recent Window Size prices, finding a number of user-specified clusters. See here to find more information on cluster detection.
The channel extremities are returned as the centroid of the lowest, average, and highest price clusters.
K-means clustering can be computationally expensive and as such we allow users to determine the maximum number of iterations used to find the centroids as well as the number of most historical bars to perform the indicator calculation. Do note that increasing the calculation window of the indicator as well as the number of clusters will return slower results.
🔶 SETTINGS
Window Size: Amount of most recent prices to use for the calculation of the indicator.
Clusters": Amount of clusters detected for the calculation of the indicator.
Denoise Channels: When enabled, return less noisy channels extremities, disabling this setting will return the exact centroids at each time but will produce less regular extremities.
As Trailing Stop: Display the indicator as a trailing stop.
🔹 Optimization
This group of settings affects the runtime performance of the script.
Maximum Iteration Steps: Maximum number of iterations allowed for finding centroids. Excessively low values can return a better script load time but poor clustering.
Historical Bars Calculation: Calculation window of the script (in bars).
Trend Confirmation StrategyThe profitability and uniqueness of a trading strategy depend on various factors including market conditions, risk management, and the strategy's ability to capitalize on price movements. I'll describe the strategy provided and highlight its potential benefits and differences compared to other strategies:
Strategy Overview:
The provided strategy combines three technical indicators: Supertrend, MACD, and VWAP. It aims to identify potential entry and exit points by confirming trend direction and considering the proximity to the VWAP level. The strategy also incorporates stop-loss and take-profit mechanisms, as well as a trailing stop.
Unique Aspects and Potential Benefits:
Trend Confirmation: The strategy uses both Supertrend and MACD to confirm the trend direction. This dual confirmation can increase the likelihood of accurate trend identification and filter out false signals.
VWAP Confirmation: The strategy considers the proximity of the price to the VWAP level. This dynamic level can act as a support or resistance and provide additional context for entry decisions.
Adaptive Stop Loss: The strategy sets a stop-loss range, which helps provide some tolerance for minor price fluctuations. This adaptive approach considers market volatility and helps prevent premature stop-loss triggers.
Trailing Stop: The strategy incorporates a trailing stop mechanism to lock in profits as the trade moves in the desired direction. This can potentially enhance profitability during strong trends.
Partial Profit Booking: While not explicitly implemented in the provided code, you could consider booking partial profits when the MACD shows a crossover in the opposite direction. This aspect could help secure gains while still keeping exposure to potential further price movements.
Key Differences from Other Strategies:
Dual Indicator Confirmation: The combination of Supertrend and MACD for trend confirmation is a unique aspect of this strategy. It adds an extra layer of filtering to enhance the accuracy of entry signals.
Dynamic VWAP: Incorporating the VWAP level into the decision-making process adds a dynamic element to the strategy. VWAP is often used by institutional traders, and its inclusion can provide insights into the market sentiment.
Adaptive Stop Loss and Trailing: The strategy's use of an adaptive stop-loss range and a trailing stop can help manage risk and protect profits more effectively during changing market conditions.
Partial Profit Booking: The suggestion to consider partial profit booking upon MACD crossovers in the opposite direction is a practical approach to secure gains while staying in the trade.
Caution and Considerations:
Backtesting: Before deploying any strategy in real trading, it's crucial to thoroughly backtest it on historical data to understand its performance under various market conditions.
Risk Management: While the strategy has built-in risk management mechanisms, it's essential to carefully manage position sizes and overall portfolio risk.
Market Conditions: No strategy works well in all market conditions. It's important to be flexible and adjust the strategy or refrain from trading during particularly volatile or unpredictable periods.
Continuous Monitoring: Even though the strategy includes automated components, continuous monitoring of the trades and market conditions is necessary.
Adaptability: Markets can change over time. Traders need to be prepared to adapt the strategy as necessary to stay aligned with evolving market dynamics.

MarketStructureLibrary "MarketStructure"
This library contains functions for identifying Lows and Highs in a rule-based way, and deriving useful information from them.
f_simpleLowHigh()
This function finds Local Lows and Highs, but NOT in order. A Local High is any candle that has its Low taken out on close by a subsequent candle (and vice-versa for Local Lows).
The Local High does NOT have to be the candle with the highest High out of recent candles. It does NOT have to be a Williams High. It is not necessarily a swing high or a reversal or anything else.
It doesn't have to be "the" high, so don't be confused.
By the rules, Local Lows and Highs must alternate. In this function they do not, so I'm calling them Simple Lows and Highs.
Simple Highs and Lows, by the above definition, can be useful for entries and stops. Because I intend to use them for stops, I want them all, not just the ones that alternate in strict order.
@param - there are no parameters. The function uses the chart OHLC.
@returns boolean values for whether this bar confirms a Simple Low/High, and ints for the bar_index of that Low/High.
f_localLowHigh()
This function finds Local Lows and Highs, in order. A Local High is any candle that has its Low taken out on close by a subsequent candle (and vice-versa for Local Lows).
The Local High does NOT have to be the candle with the highest High out of recent candles. It does NOT have to be a Williams High. It is not necessarily a swing high or a reversal or anything else.
By the rules, Local Lows and Highs must alternate, and in this function they do.
@param - there are no parameters. The function uses the chart OHLC.
@returns boolean values for whether this bar confirms a Local Low/High, and ints for the bar_index of that Low/High.
f_enhancedSimpleLowHigh()
This function finds Local Lows and Highs, but NOT in order. A Local High is any candle that has its Low taken out on close by a subsequent candle (and vice-versa for Local Lows).
The Local High does NOT have to be the candle with the highest High out of recent candles. It does NOT have to be a Williams High. It is not necessarily a swing high or a reversal or anything else.
By the rules, Local Lows and Highs must alternate. In this function they do not, so I'm calling them Simple Lows and Highs.
Simple Highs and Lows, by the above definition, can be useful for entries and stops. Because I intend to use them for trailing stops, I want them all, not just the ones that alternate in strict order.
The difference between this function and f_simpleLowHigh() is that it also tracks the lowest/highest recent level. This level can be useful for trailing stops.
In effect, these are like more "normal" highs and lows that you would pick by eye, but confirmed faster in many cases than by waiting for the low/high of that particular candle to be taken out on close,
because they are instead confirmed by ANY subsequent candle having its low/high exceeded. Hence, I call these Enhanced Simple Lows/Highs.
The levels are taken from the extreme highs/lows, but the bar indexes are given for the candles that were actually used to confirm the Low/High.
This is by design, because it might be misleading to label the extreme, since we didn't use that candle to confirm the Low/High..
@param - there are no parameters. The function uses the chart OHLC.
@returns - boolean values for whether this bar confirms an Enhanced Simple Low/High
ints for the bar_index of that Low/High
floats for the values of the recent high/low levels
floats for the trailing high/low levels (for debug/post-processing)
bools for market structure bias
f_trueLowHigh()
This function finds True Lows and Highs.
A True High is the candle with the highest recent high, which then has its low taken out on close by a subsequent candle (and vice-versa for True Lows).
The difference between this and an Enhanced High is that confirmation requires not just any Simple High, but confirmation of the very candle that has the highest high.
Because of this, confirmation is often later, and multiple Simple Highs and Lows can develop within ranges formed by a single big candle without any of them being confirmed. This is by design.
A True High looks like the intuitive "real high" when you look at the chart. True Lows and Highs must alternate.
@param - there are no parameters. The function uses the chart OHLC.
@returns - boolean values for whether this bar confirms an Enhanced Simple Low/High
ints for the bar_index of that Low/High
floats for the values of the recent high/low levels
floats for the trailing high/low levels (for debug/post-processing)
bools for market structure bias
